The Sports Bubble and What It Means For TV


The broadcasting of live sport has been a key part of TV’s appeal and underpins the pay-TV ecosystem. However, a combination of entrenched cord-cutting and an ageing audience means that revenues are now moving out of synch with inflating domestic sports rights costs.
The sports bubble is moving from euphoria into Profit Taking
Pay-TV is a technology catalyst that has transformed sports rights into a must-have component of the cable and satellite landscape. As pay-TV networks such as ESPN bid up the rights to exclusive sports franchises, free-to-air broadcasters have been compelled to respond in kind, sparking a bidding war for sports content. This has led to a boom in sports right franchises: the NBA domestic broadcast rights increased from $7.4 billion 2007-2015 to $24 billion 2016-2025 – an increase of 323%.
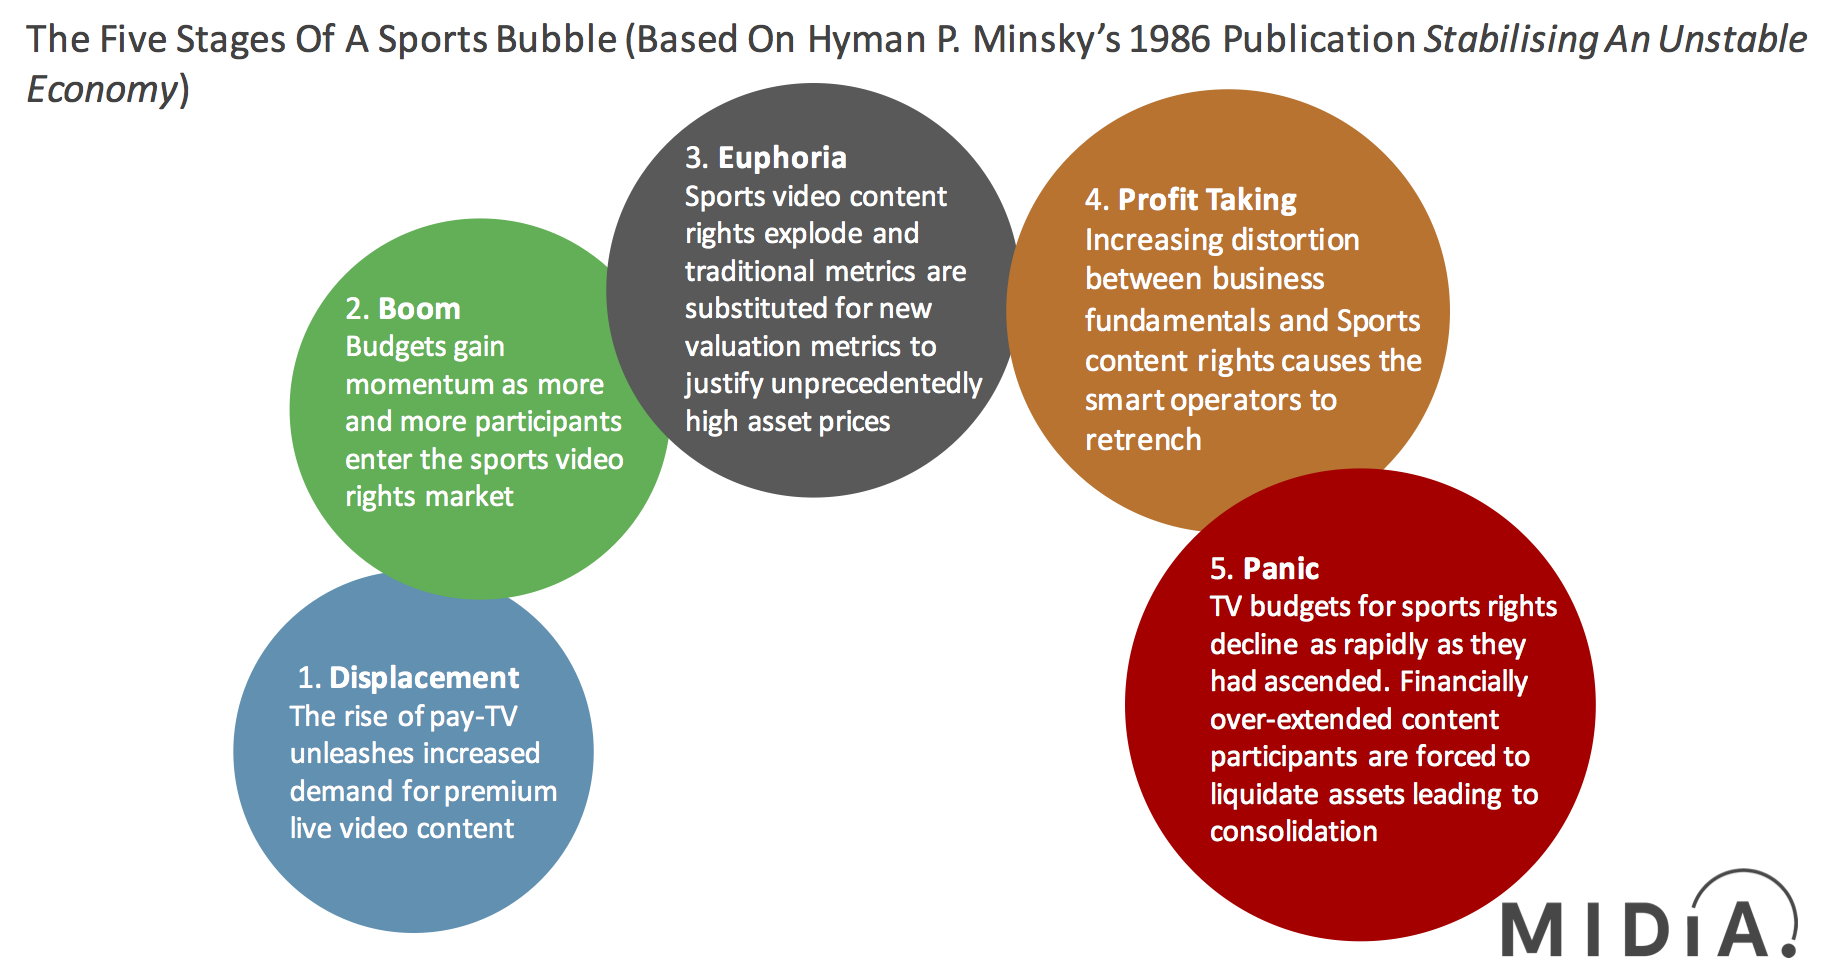
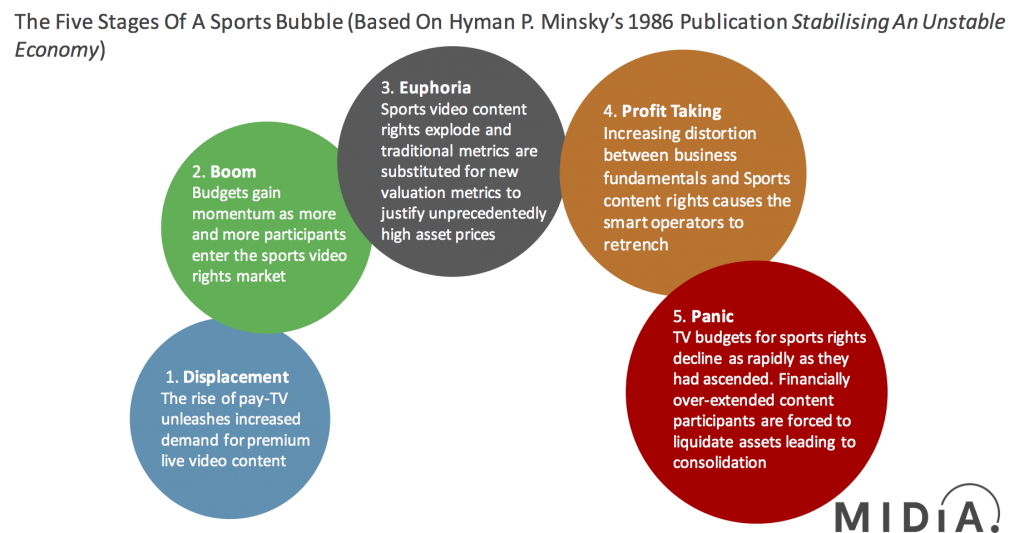
The sports rights landscape therefore is starting to resemble a bubble economy as outlined by economist Hyman P. Minsky in his book “Stabilising An Unstable Economy” (1986). The five stages of a market bubble according to Minsky are:
Displacement: A displacement occurs when investors are enamoured by a new paradigm, such as an innovative new technology or interest rates that are historically low.Boom: Prices gain momentum as more participants enter a market. During this phase, the asset class attracts widespread media coverage. Fear of missing out spurs more speculation drawing increasing numbers of participants into the sector.Euphoria: During this phase asset prices explode and traditional metrics are substituted for new valuation metrics to justify the unprecedented high asset prices.Profit Taking: The smart money heeding the warning signs between the escalating assets valuations and the underlying fundamentals of the sector starts to close out their positions and take their profits. This effectively pricks the bubble and once significant players start to pull back from the market the bubble cannot be reinflated.Panic: Asset prices reverse course, declining as rapidly as they ascended. Financially over-extended market participants are forced to liquidate assets at a loss and supply overwhelms demand, further accelerating price declines.Adapting this framework to the sports rights landscape leads to an understanding of how the sports bubble emerged. In this month’s MIDiA Research Report entitled The Sports Rights Bubble – Reaching The Tipping Point, we decipher and analyse which stage of the sports bubble we are currently in, and what the implications are for TV and digital video. This report deep dives into the domestic sports franchise business models in the US, UK and Canada and the digital consumption behaviour of audiences in these territories based upon our quarterly survey data.
Key findings include:
Rights revenue for the US, UK and Canadian domestic sport rights franchises was up XXX% between 2014 and 2016The 10 largest US, UK, Canada sports broadcasters spent $XXX billion on sports rights in 2017ROI for domestic sports rights in the US, UK and Canada peaked in 2015 a XX returnROI on domestic sports rights XX by XX% between 2014 and 2016 in the US, UK and CanadaNew entrants Amazon and Facebook will XXX on sports rightsXX% of sports TV viewers in the US, UK, Canada and Australia are aged XXOnly X% of under 25s in the US, UK, Canada and Australia regularly watch sports on TVCord-cutting penetration in US, UK, Canada and Australia was X% in Q3 2017

The discussion around this post has not yet got started, be the first to add an opinion.