Overanalysing our Spotify Wrapped: what MIDiA’s stats say about the industry

4 Dec 2023
Tags
Companies
It would not be the holidays without Spotify Wrapped, the ubiquitous marketing scheme that involves Spotify repackaging the vast amount of data it collects about users into fun personalised insights ready for social media. Love it or loathe it, Wrapped has proven irresistible and the MIDiA team is far from immune.
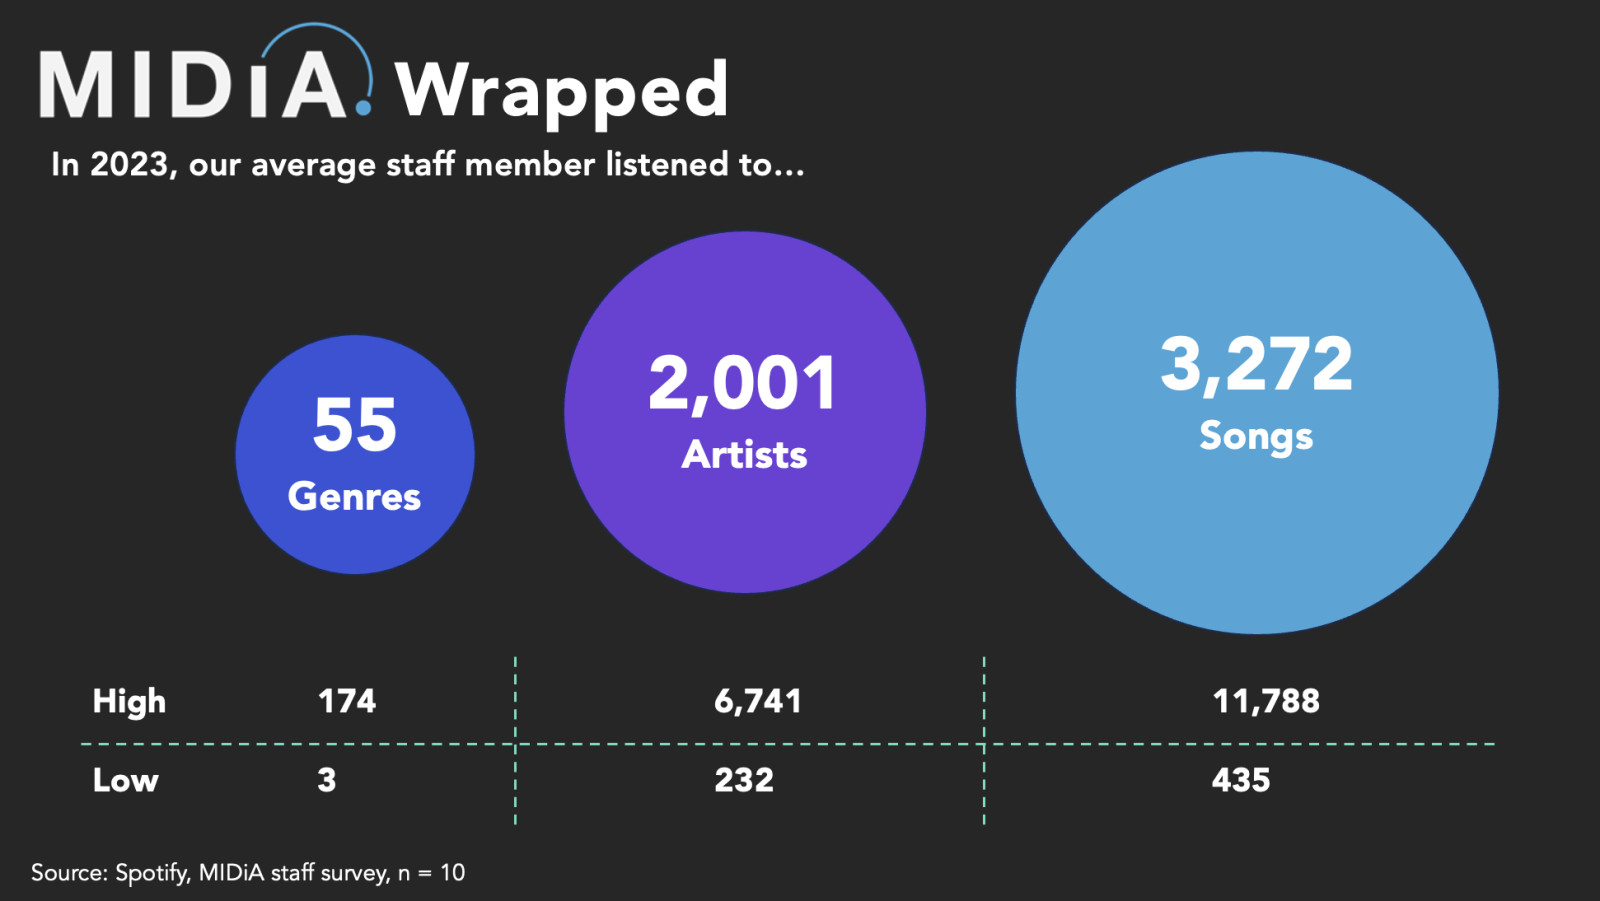
So we did what we do best. We collected Wrapped data from 10 MIDiA members who use Spotify to find the average number of genres, artists, and songs we listened to on Spotify in 2023. The results laid bare many of the trends we have been studying. No wonder artists struggle to break through the noise and find repeat listeners when we stream an average of 3,272 different songs per year! However, the data also revealed some surprises and paradoxes.
Of course, the major caveat is that we are looking at the listening behaviours of entertainment company employees, including music analysts — far from the average Spotify user. To be clear, this was a light (and semi-fun) exercise designed to illustrate what Wrapped can say about listening habits, not a formal evidence base. With that said, let’s break down what we found.
Genre is fluid, indeed
We listened to an average of 55 genres each (with a high of 174!), reflecting what we already know: listeners are increasingly genre-fluid. Of course, part of what has changed is the categorisation itself. Spotify classifies music into hundreds of sub-genres. Regardless of how long these sub-genres have existed, we did not begin classifying them and measuring their consumption until relatively recently in music history. Still, as culture fragments, there are surely more sub-genres today than existed in the past and today’s listeners are less likely to be genre-dependent at all.
We listened to just two songs per artist
Today’s listeners also seem to orient their listening around songs more than artists — while listening to more of both than ever before. We listened to an average of 2,001 artists and 3,272 songs each. For reference, our top streamer listened to over 6,000 different artists in 2023, and over 11,000 songs!
This translates to an average of fewer than two songs per artist. While more artists are getting exposure to audiences, it is increasingly hard to find repeat listeners as users spread their listening across a wider range of both songs and artists than ever. This may be why the broad sentiment from MIDiA staff and friends alike is that our top songs feel…a bit random. I love Mitski, but was surprised to see ‘Bug Like An Angel’ as my top song — and even more surprised to see it had only 29 plays. It seems we are giving many songs a similar number of plays each, rather than playing a couple of favourite songs much more than others. The result is that our “top” songs are a bit arbitrary. In other words, the difference between the songs in my top five and top 100 could be just a handful of plays.
Featured Report
Defining entertainment superfans Characteristics, categories, and commercial impact
Superfans represent a highly valuable yet consistently underleveraged audience segment for the entertainment industry. What drives this disconnect is the fact that – despite frequent anecdotal use of the term – a standardised, empirical definition remains absent, preventing companies from systematically identifying, nurturing, and monetising th...
Find out more…Streams do not equal fans — and vice versa
Top artists were a different story. Most people felt their top artists made sense and, in fact, tended to be similar year after year (even if top songs varied and were not necessarily connected to top artists). Perhaps artist fandom is cutting through, but in the grand scheme of things, among the thousands of songs we listen to it is not reflected in actual consumption as much as one might expect. There is much more to fandom than streams.
In the streaming economy, are normies more valuable than music-heads?
This leads to another paradox. Conventional wisdom says that the music industry should go after the biggest music fans — those who listen the most and are keen to discover. But as our data reflects, the best position an artist can be in right now is to have fans who have listened to them on repeat for years and are not bothered about discovering anything else.
Not all streams are created equal. Different types of listeners offer different value to different stakeholders:
Listeners who are driven by artist fandom stream a handful of favourite artists more, but less music overall — driving more value for artists
Listeners who are driven by overall music fandom / discovery listen to more music overall, but are less likely to focus on any individual artist — driving more value for DSPs and record labels
It is more advantageous to strike a chord with a normie than with a music-head who is likely to spread listening across many favourites
Regardless, the stats also make it clear why few artists can depend on streaming for meaningful revenue. According to Billboard’s streaming royalty calculator, my 29 plays of ‘Bug Like An Angel’ would generate about 14 cents. Sure, I streamed more Mitski songs than just that track, and for some artists, a handful of cents per fan could add up to a sizable amount. But as consumers spread their listening across more songs than ever, the value for an artist of having a consumer’s “top song” of the year is declining.
What are we really even measuring?
It is important to note that Wrapped is an incomplete picture of listening habits. Many staffers caveated that they do equally as much, or more, listening on platforms like YouTube, SoundCloud, and BBC Sounds. We also all use streaming platforms for different things: Spotify might be for putting on playlists while we work, while YouTube might get the more intentionally searched-for songs and artists. The same listener could have very different Wrapped-s for each platform they use.
As MIDiA’s Kriss Thakrar put it, maybe Spotify Wrapped is less an indicator of how we love music and express fandom, and more just an indicator of how we use Spotify. Or, as MIDiA’s Rutger Rosenborg countered, “how Spotify uses us”.
Want the latest entertainment research and insights directly to your inbox? Our newsletter has you covered, click here to subscribe.
There is a comment on this post, add your opinion.