MIDIA RESEARCH 2018–2026 STREAMING MUSIC FORECASTS


MIDiA has just published its global music forecasts, with revenue and user numbers projected out to 2026 (a list of data items and countries covered are listed at the bottom of this post).
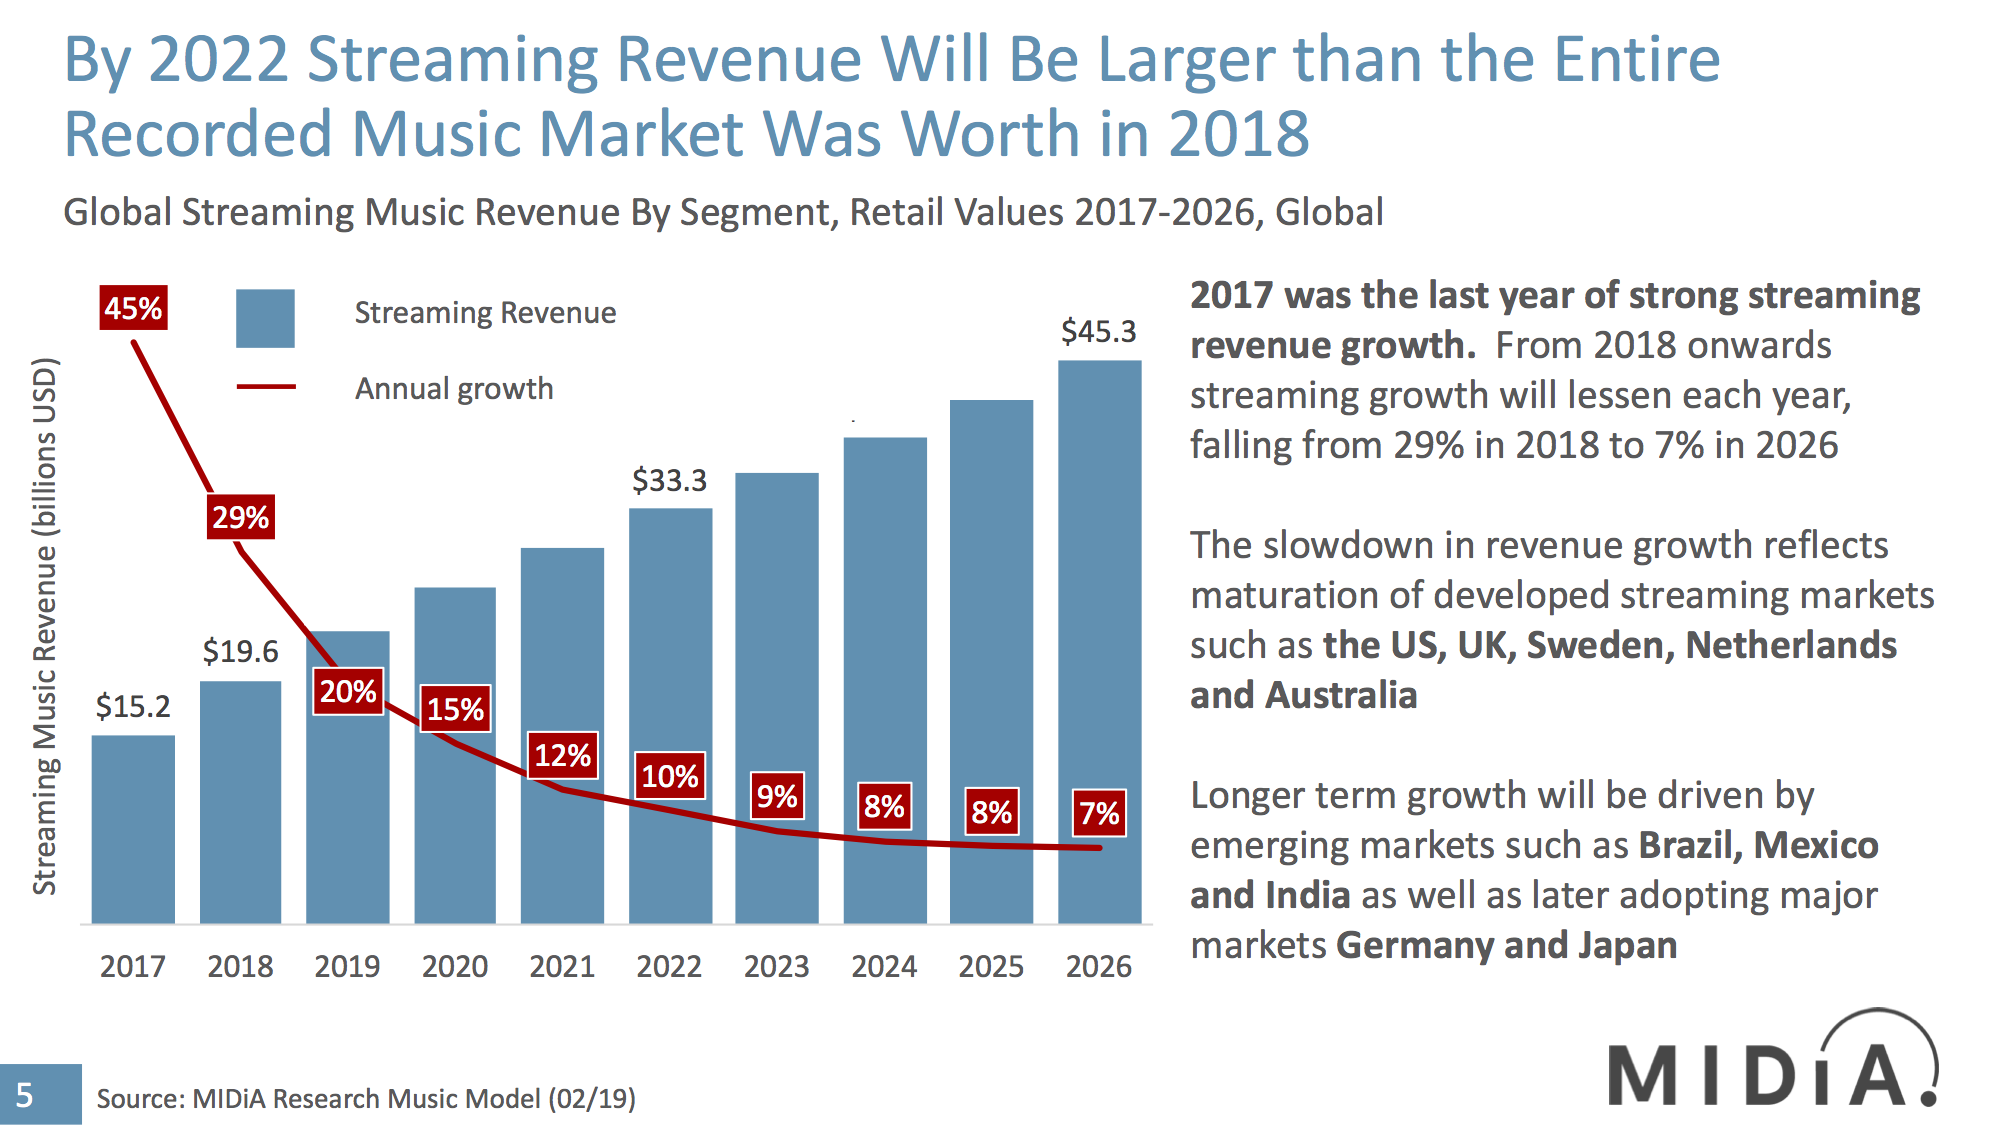
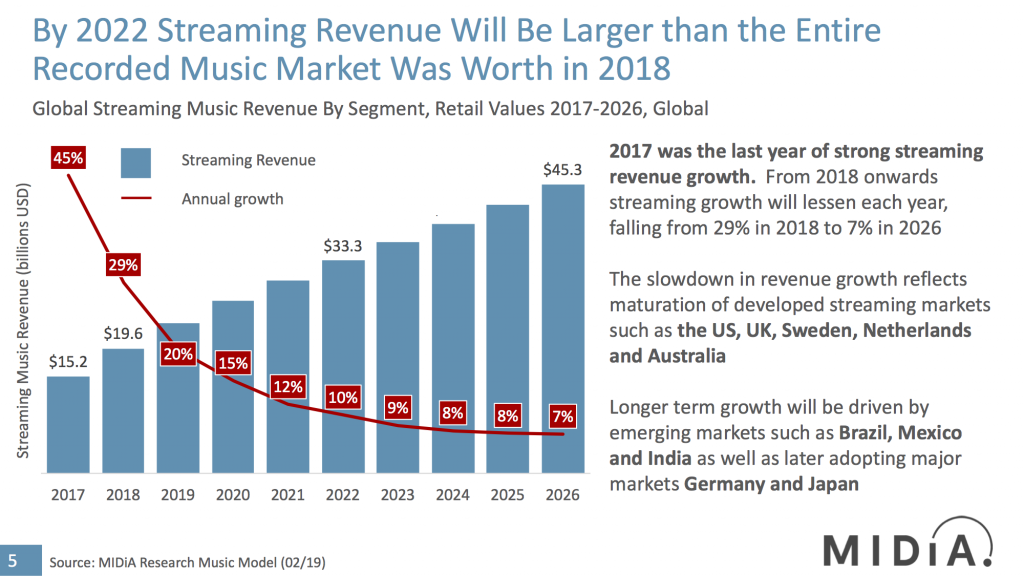
2017 was the last year of strong streaming revenue growth.From 2018 onwards streaming growth will lessen each year, falling from 29% in 2018 to 7% in 2026. The slowdown in revenue growth reflects maturation of developed streaming markets such as the US, UK, Sweden, Netherlands and Australia. Longer term growth will be driven by emerging markets such as Brazil, Mexico and Indiaas well as later adopting major markets Germany and Japan.

Even with this slowing rate there is a lot of growth left in the market – so much so, in fact, that the market will grow from $19.6 billion in 2018 (in retail terms) to $45.3 billion in 2026. This means the market will more than double.We also have all of the market numbers in label trade revenue terms, but we are focusing on retail revenues for a crucial reason: the difference between trade revenues and retail revenues will widen between now and 2026. This reflects a number of factors that will see streaming services improve their margins and thus widen the gap on label revenues:
- Rising publishing related rates
- Increased share of royalty pot going to non-music content
- Increased share of royalty pot going to non-label music
- Potential long-term future label rate cuts (e.g. relief for price hikes)
The last item won’t happen in the current round of negotiations with rights holders, but at the next round more power will lie with streaming services. Right now, Spotify poses a lot of threat in rightsholder eyes, but its actual power is more limited. Streaming revenues accounted for 51% of label revenues in 2018 and with Spotify accounting for less than half of that, this means that Spotify accounts for less than a quarter of total label revenues. The labels, publishers and right bodies need to maximize their negotiating power now, while they can.
This will change, and when combined with the other three factors, the conclusion is clear: label trade revenues are becoming a progressively less useful way of measuring the future size of the streaming market.
In subscriber terms, at the end of 2018 there were 278 million paid subscribers. However, due to the impact of family plan accounts, unique subscriptions were only 242 million. The 2 biggest streaming markets in 2018 (US and UK) will remain the largest by 2026 while large markets such as Germany and France will also still be large, leading markets. Brazil, India, MENA and China will all be established as top 15 global markets by 2026, with the first four each more than doubling revenue compared to 2018.
MIDiA clients can access the report and full dataset right now here. Clients can also explore the forecastsin our forecasts viewer on our data portal Fuse here.
The report and data are also available for purchase on the MIDiA report store here.
List of data points and markets:
- Subscription revenue (retail values)
- Audio Ad supported revenue (retail values)
- Video Ad supported revenue (retail values)
- Total Ad supported streaming revenue (retail values)
- Total streaming revenue (retail values)
- Downloads revenue (retail values)
- Total digital revenue (retail values)
- Physical revenue (retail values)
- Other revenue (retail values)
- Total recorded music revenue (retail values)
- Subscription revenue (label trade values)
- Audio ad supported revenue (label trade values)
- Video ad supported revenue (label trade values)
- Total ad supported streaming revenue (label trade values)
- Total streaming revenue (label trade values)
- Downloads revenue (label trade values)
- Total digital revenue (label trade values)
- Physical revenue (label trade values)
- Other revenue (label trade values)
- Total recorded music (label trade values)
- Subscribers
- Subscriptions (unique accounts)
- Ad supported audio users
- Ad supported video users
- Subscriber ARPU (USD) - Retail values
- Ad supported audio ARPU (USD) - Gross revenues
- Ad supported video ARPU (USD) - Gross revenues
- Subscriber ARPU (USD) - Trade values
- Ad supported audio ARPU (USD) - Trade revenues
- Ad supported video ARPU (USD) - Trade revenues
- Audio streams
- Spotify subscribers
- Apple Music subscribers
Countries covered
- US
- Canada
- Austria
- Belgium
- Denmark
- Finland
- France
- Germany
- Italy
- Netherlands
- Norway
- Poland
- Spain
- Sweden
- Switzerland
- UK
- Other Europe
- Australia
- China
- India
- Indonesia
- Japan
- Philippines
- South Korea
- Taiwan
- Thailand
- Other Asia
- Argentina
- Brazil
- Colombia
- Mexico
- Other Latin America
- Russia
- Middle East and North Africa
- North America
- Europe
- Asia Pacific
- Latin America
- Rest of World
- Global Total
Datasheets included in the Excel document:
- Global Summary - Retail Values
- Retail Summary
- Global Summary - Trade Values
- Trade Summary
- User Summary
- Spotify + Apple
- Country Summaries - Retail
- Country Summaries - Trade
- Top Streaming Markets - Retail Values
- Subscriber Market Shares
- Methodology

The discussion around this post has not yet got started, be the first to add an opinion.